Lab128 - Tools for Advanced Oracler Tuning and Monitoring.
Reference Guide.
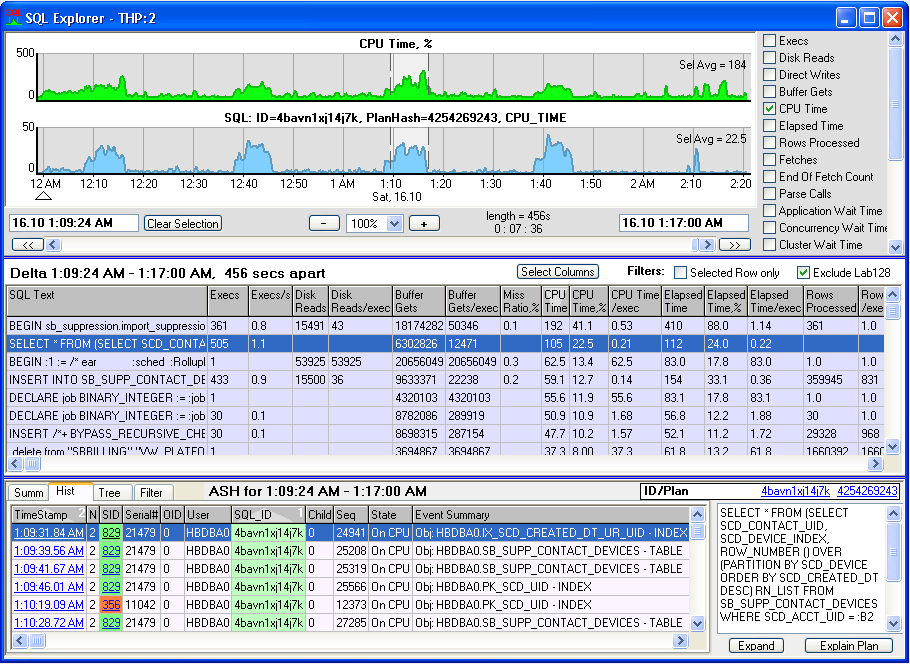
SQL Explorer
SQL Explorer Concept and General Guidelines.
SQL Explorer helps find the most expensive queries at any time interval and helps explore individual SQL statement to the finest detail.
SQL Explorer works by taking snapshots of v$sql view (or v$sqlstats on 10g) and calculating deltas between snapshots.
If snapshots are taken frequently, a grand picture of SQL statements performed at any moment in time can be
reconstructed with high precision.
Every important SQL statistic such as number of gets, number of reads, elapsed time,
CPU time etc are recorded and can be used to reveal the SQL statements responsible for spending the server's resources.
The biggest advantage of this approach is that it captures all SQL activity. With the ASH (Active Session History) approach
used in the Activity Explorer, it is possible to have short and frequent queries go undetected.
Using v$sql snapshots, SQL Explorer catches all activity and then breaks it down into individual SQL statements.
It has a minor disadvantage: unlike ASH, there is no information available to find which user / machine / program / DB object was
involved in the activity. If these two approaches are combined, the strongest sides of both methods complement each other
and make a very powerful tool. This is exactly what SQL Explorer does.
As with many other forms in Lab128, SQL Explorer offers top to bottoms detail levels:
from a general overview of statistics for all statements, down to individual statements,
and then down to ASH details of a selected statement.
SQL Explorer has three areas: the top area contains charts of SQL statistics aggregated across all SQL statements;
the middle area contains data for individual statements presented in tabular form;
the bottom area contains ASH details for the SQL statement selected in the middle area.
To better understand how to use the SQL Explorer, let's walk through the typical troubleshooting scenario.
Imagine that in the Main Screen you have seen high Physical Reads activity.
To see it more closely, you would click on the chart to get a bigger Detail Chart.
Here, you can zoom in or out and scroll back in time until you identify the time period you would like to explore
in more detail. Select this time interval,
then right-click and select "Show in SQL Explorer". This will bring SQL Explorer up front with the time interval selected for you.
For convenience, the Physical Reads chart is also shown. There are SQL statements shown for the selected period of time.
Because you are interested in disk reads, click on the "Disk Reads" column header to have SQL statements sorted by this statistic.
The top few statements will probably be of most interest, so you would click on them to select the statement.
The bottom part shows the ASH details and the SQL text of the query.
To see the chart of the selected SQL statement, right-click and select "Show Graph for selected SQL" to add the chart to the top section.
To find the corresponding SQL statement in the grid below, right click on a chart and select "Locate SQL for this Graph".
The top SQL statements may be different for different sorting criteria.
The sort should be based on the nature of the bottleneck in the system.
As general guidelines, sort by the "Disk Reads" column when investigating high I/O usage, "CPU Time" and "Buffer Gets"
when troubleshooting CPU-bound system, and "Application Wait Time" to find SQL with locking issues.
When experiencing a high number of active sessions or optimizing the response time of the system, use the "Elapsed Time" column.
These are the most common sorting criteria.
Of course, there can be combinations of bottlenecks and other circumstances when you should look at other columns as well.
Viewing options.
Use the check boxes on the right side of the Charts area to add or remove SQL statistic charts.
Any chart can also be removed by using its pop-up menu.
Many other rules for Statistics Detailed Charts also apply to the Charts area.
In the SQL Statement Details middle area, use the "Selected Row only" check box if you want to focus on a particular SQL statement.
Then you can play with time selection without worrying that the selected line will go out of the visible area
because its place in the top list has changed.
Uncheck the "Exclude Lab128" check box if you want to see statistics on queries used by this application to gather performance data.
To change the criteria for top SQL statements, click on a column header to change sorting.
To display a chart for the selected SQL statement, right-click on a SQL statement and select "Show Graph for selected SQL".
Then choose the statistic(s) to display.
Select the row in the SQL Statement Details table to see the SQL text and ASH data in the bottom area.
If ASH data is missing, this is because of the limits of ASH approach (see explanations in the Concept above).
When ASH data is available, there are several options to view that data.
Because the ASH box is identical to the one used in Activity Explorer,
please see the description and usage guidelines in the Viewing Active Session History in Summary
and History tabbed views section.
SQL Statistics Settings.
SQL Explorer uses data collected from v$sql or v$sqlstats view.
There are options to change the rate of collection or turn it off completely.
This can be done in the Settings screen.
See the section SQL Statistics Settings for more details.
Descriptions of the columns in the SQL Explorer.
Almost all data originates from v$sql view, or v$sqlstats view in Oracle 10g Release 2.
SQL statement data correspond to the individual cursor identified by either SQL_ID, PLAN_HASH_VALUE,
and CHILD_NUMBER (10g R1); ADDRESS, HASH_VALUE, CHILD_NUMBER (9i and earlier);
or all cursors identified by SQL_ID, PLAN_HASH_VALUE (10g R2 or later).
SQL Text- SQL Text of the statement (either v$sql.sql_fulltext (10g), or from v$sqltext_with_newlines.sql_text - also cached by Lab128 internally on LRU basis);
Execs- Number of executions during selected period of time (v$sql.EXECUTIONS);
Execs/s- Average number of executions in selected period of time (v$sql.EXECUTIONS / time period);
Disk Reads- Number of disk reads during selected period of time (v$sql.DISK_READS);
Disk Reads/s- Average number of disk reads per second during selected period of time (v$sql.DISK_READS / time period);
Disk Reads/exec - Number of disk reads per execution during selected period of time (v$sql.DISK_READS / v$sql.EXECUTIONS);
Direct Writes- Number of direct writes during selected period of time (v$sql.DIRECT_WRITES);
Direct Writes/exec - Number of direct writes per execution during selected period of time (v$sql.DIRECT_WRITES / v$sql.EXECUTIONS);
Buffer Gets- Number of buffer gets during selected period of time (v$sql.BUFFER_GETS);
Buffer Gets/s- Average number of buffer gets per second during selected period of time (v$sql.BUFFER_GETS / time period);
Buffer Gets/exec - Number of direct buffer gets per execution during selected period of time (v$sql.BUFFER_GETS / v$sql.EXECUTIONS);
CPU Time- CPU time (in seconds) used during selected period of time (v$sql.CPU_TIME / 1000000). Please note, that this value can be bigger than selected period of time if several sessions were executing same cursor at the same time on multi-CPU machine;
CPU Time,%- Average percentage of CPU used during selected period of time (v$sql.CPU_TIME / 1000000 / time period * 100%). Please note, that this value can be bigger than 100% if several sessions were executing same cursor at the same time on multi-CPU machine;
CPU Time /exec - CPU time (in seconds) per execution during selected period of time (v$sql.CPU_TIME / 1000000 / v$sql.EXECUTIONS);
Elapsed Time- Elapsed time (in seconds) during selected period of time (v$sql.ELAPSED_TIME). Please note, that this value can be bigger than selected period of time if several sessions were executing same cursor at the same time;
Elapsed Time,% - Average percentage of time this SQL was active during selected period of time (v$sql.ELAPSED_TIME / 1000000 / time period * 100%). Please note, that this value can be bigger than 100% if several sessions were executing same cursor at the same time;
Elapsed Time/exec- Elapsed time (in seconds) per execution during selected period of time (v$sql.ELAPSED_TIME / 1000000 / v$sql.EXECUTIONS);
Rows Processed - Number of rows returned by SQL statement during selected period of time (v$sql.ROWS_PROCESSED);
Rows /exec- Number of rows returned by SQL statement per execution during selected period of time (v$sql.ROWS_PROCESSED / v$sql.EXECUTIONS);
Fetches- Number of fetches performed during selected period of time (v$sql.FETCHES);
Fetches /exec- Number of fetches performed per execution during selected period of time (v$sql.FETCHES / v$sql.EXECUTIONS);
End Of Fetch Count - Number of times this cursor was fully executed fetching all rows (v$sql.END_OF_FETCH_COUNT);
Parse Calls- Number of parse calls during selected period of time (v$sql.PARSE_CALLS);
Application Wait Time- Application wait time (in seconds) during selected period of time (v$sql.APPLICATION_WAIT_TIME);
Application Wait Time/exec- Application wait time (in seconds) per execution during selected period of time (v$sql.APPLICATION_WAIT_TIME / v$sql.EXECUTIONS);
Concurrency Wait Time- Concurrency wait time (in seconds) during selected period of time (v$sql.CONCURRENCY_WAIT_TIME);
Concurrency Wait Time/exec- Concurrency wait time (in seconds) per execution during selected period of time (v$sql.CONCURRENCY_WAIT_TIME / v$sql.EXECUTIONS);
Cluster Wait Time- Cluster wait time (in seconds) per execution during selected period of time (v$sql.CLUSTER_WAIT_TIME / v$sql.EXECUTIONS);
Cluster Wait Time/exec- Cluster wait time (in seconds) per execution during selected period of time (v$sql.CLUSTER_WAIT_TIME / v$sql.EXECUTIONS);
USER I/O Wait Time- User I/O wait time (in seconds) per execution during selected period of time (v$sql.USER_IO_WAIT_TIME / v$sql.EXECUTIONS);
USER I/O Wait Time/exec- User I/O wait time (in seconds) per execution during selected period of time (v$sql.USER_IO_WAIT_TIME / v$sql.EXECUTIONS);
PL/SQL Exec Time- PL/SQL execution time (in seconds) per execution during selected period of time (v$sql.PLSQL_EXEC_TIME / v$sql.EXECUTIONS);
PL/SQL Exec Time/exec- PL/SQL execution time (in seconds) per execution during selected period of time (v$sql.PLSQL_EXEC_TIME / v$sql.EXECUTIONS);
Java Exec Time- Java execution time (in seconds) per execution during selected period of time (v$sql.JAVA_EXEC_TIME / v$sql.EXECUTIONS);
Java Exec Time/exec- Java execution time (in seconds) per execution during selected period of time (v$sql.JAVA_EXEC_TIME / v$sql.EXECUTIONS);
Serializable Aborts- Number of times the transaction fails to serialize during selected period of time (v$sql.SERIALIZABLE_ABORTS);
Loads- Number of times the object was either loaded or reloaded during selected period of time (v$sql.LOADS);
Invalidations- Number of times this cursor has been invalidated during selected period of time (v$sql.INVALIDATIONS);
Sorts- Number of sorts during selected period of time (v$sql.SORTS);
PX Servers Executions - Number of executions performed by Parallel Execution Servers during selected period of time (v$sql.PX_SERVERS_EXECUTIONS);
SQL_ID- Identifier of SQL statement (v$sql.SQL_ID);
SQL_Addr- Hexadecimal address of the cursor (v$sql.ADDRESS);
SQL_Hash- Hash value of SQL statement (v$sql.HASH_VALUE);
Plan Hash- Execution plan hash value (v$sql.PLAN_HASH_VALUE);
Child- Child number of the cursor (v.sql.CHILD_NUMBER).