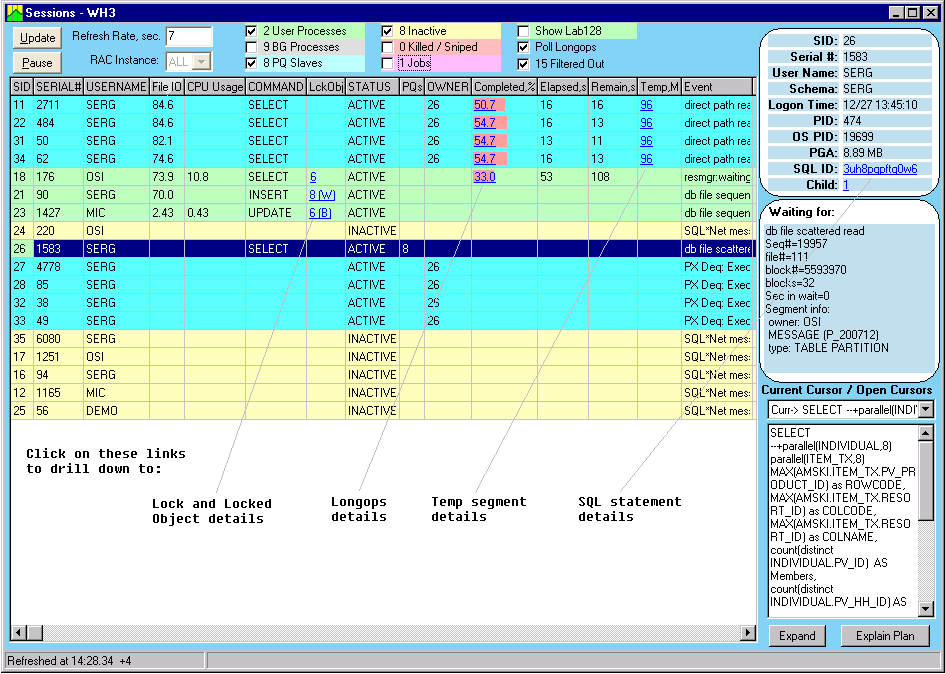
The Session Details window lists sessions and provides session details in a convenient format. It provides the following information: which sessions are the top resource consumers; which sessions are active; what they are doing or waiting for; which open cursors the session has; what current SQL is running; the progress of long operation; how many locks are taken by the session; how much temporary space is taken; what are the parallel query slave sessions for the active session. Like many other windows, it contains shortcuts / hot spots to get more detail. For example, to see which locks are taken, click on the LckObj column to open the Locks and Locked Objects window.
The Session Details window offers other actions related to the sessions such as obtaining the Execution Plan for the selected cursor or session administration - killing / tracing sessions (with corresponding privileges granted).
There are three tab views in this window: Sessions - described in next section; Blocking and Waiting Sessions - a tree view of blockers and waiters; Filters - user-defined filters for this window.
The check boxes in the upper part of this window show selected categories of sessions. The following session categories are available: User Active; Background; Parallel Query PQ Slaves; Inactive; Killed / Sniped; Queue Jobs.
To include info about Long operations, check the "Poll Longops" box. This option is recommended for the data warehouse type of queries.
To get more details about a session, select it. The three sections to the right of the Session list provide additional details about the selected session. The upper section is a collection of fields showing the data from v$session and v$process views. The middle section shows the current waits of the selected session. The lower section lists all open cursors, with the current one (in execution) marked with 'Curr'. Use the drop-down list to browse all open cursors and the box below it will show the SQL text of the selected cursor.
The Session Details window updates itself automatically and the refresh rate can be changed. To force a refresh ahead of schedule, press the "Update" button. To stop refreshing, press the "Pause" button. The content of this window will be frozen in Pause mode. To resume automatic refresh, press the "Update" button.
Note. The information presented on this screen originates from different views: v$session, v$process, v$bgprocess, v$sesstat, v$session_wait, v$session_longops, v$lock (see more at the bottom of this help page). Lab128 queries these views independently with the rate assigned individually to each query. The "Refresh Rate" box controls the refresh rate of the v$session view only. To change the refresh rate of other queries, use the Measurement Query Editor.
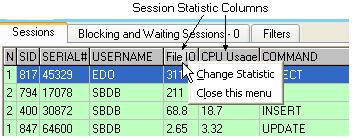
It makes sense to sort the session list using criteria such as resource usage. By default, the list is sorted in descending order by the user-selected Session Statistic columns - columns that derive values from the v$sesstat performance view. There are two such columns: by default they are "File I/O" and "CPU Usage". The first one takes values from "physical reads"+"physical writes", the second one - from "CPU used by this session". To change the statistics used by those columns, right-click on the header of the column and choose "Change Statistic" in pop-up menu. For more on statistics selection, see Select Session Statistic window.
Due to the dynamic nature of the Session list, the sessions constantly connect and disconnect. Lab128 keeps a selection bar on the selected session using its SID and Serial#. If the session disconnects, another one will be randomly selected. The list of open cursors changes too. Lab128 keeps the selection on the last selected cursor. If the list is completely refreshed, the priority is given to the current cursor - the currently executing SQL statement. Therefore, switching the selection to another session refreshes the cursor list and forces the executing cursor and corresponding SQL statement to show in the Open Cursor / SQL section. To widen the SQL text box, press the "Expand" button. To open Explain Plan for SQL shown in the SQL viewer, press the "Explain Plan" button.
If you are running Parallel queries and need to see all PQ slave sessions related to the coordinator (owner) session, select the owner session. Corresponding PQ sessions will be highlighted (see picture below in Shortcuts).
In order to kill the session: select it, right-click to open the pop-up menu, and use the "Kill selected session" item.
There are following hot spot areas / shortcuts in this window:
Right-click on the session list to open the pop-up menu:

Please note, that in RAC environment some menu items can be disabled when: Lab128 is connected to one instance, the intended operation is in the remote instance, and Oracle server version doesn't support this remote operation. For example, killing session in the remote instance is not supported in 10g and earlier versions.
The list of session can be further filtered by user-defined filters. The user-defined filters are active only when "Filtered Out" box is checked. Lab128 uses a regular expression matching algorithm. Note. All searches are case-insensitive.
Here is how it works. Internally, for each row in the Session view, the following string is constructed:
username=<USERNAME>;osuser=<OSUSER>;machine=<MACHINE>;program=<PROGRAM>;module=<MODULE>;
The <> denotes values from the corresponding columns in the Sessions view. Note that the order of fields in the string is important. There is no whitespace in the string unless they are part of the column data. This string is tested against the regular expression supplied in the edit box. If a match is found, this session is not displayed.
For those who are not familiar with regular expressions, we will explain the default expression which comes with Lab128. This should give you enough information to start playing with it and customizing it to your own needs. The default expression:
program=(oms|emagent|racgimon|nmccollector)|username=;.*program=.*J\d
has two independent parts concatenated by '| ' (pipe) character: program=(oms|emagent|racgimon|nmccollector) and username=;.*program=.*J\d The pipe character means "OR"; therefore if the match found for either of these two parts, the row is not displayed.
Let's take a look at the first sub expression: program=(oms|emagent|racgimon|nmccollector). The engine will be searching for the string "program=" and then it has 4 options listed in parenthesis, delimited by the already-familiar pipe character. All these options are ORed: if any of the following 4 strings is found, the session will not be displayed:
program=oms
program=emagent
program=racgimon
program=nmccollector
If the PROGRAM column for some session was: "emagent@oraprod4.domain.com (TNS V1-V3)" the match will be found. If, for example, you also need to filter out RMAN sessions, you can change expression to: program=(oms|emagent|racgimon|nmccollector|rman)
Now let's take a look at the second sub expression: username=;.*program=.*J\d. As you may guess, the USERNAME column should be empty to match "username=;". The dot '.' stands for any character and the '*' asterisk is a modifier to the preceding character and means it can be repeated any number of times. So together ".*" means any text. The remaining parts of this expression are:
"program=" - the string;
".*" - any text;
"J" - the single-character;
"\d" - means any digit.
So this expression is going to filter out sessions that have an empty value in USERNAME and if the value in PROGRAM is, for example, like this: "oracle@oraprod4.domain.com (J000)" - because this text contains "J0".
Let's recall that the search is case-insensitive. Therefore, this expression is functionally equivalent to the default one:
Program=(OMS|emagent|racgimon|nmccollector)|Username=;.*Program=.*j\d
Note. The filter action can be reversed using "not displayed" and "displayed" radio-buttons.
Note: All joins between data from different sources are performed internally in Lab128 to offload the monitored instance from unnecessary work.